SMRP metrics give maintenance managers the exact numbers they need to reduce downtime, improve equipment reliability, and build a maintenance program that performs consistently.
Here is what tracking the right smrp metrics delivers for your team:
Real-time visibility into equipment performance before failures occur
Clear data on where maintenance resources are being wasted
Measurable proof that your preventive maintenance program is working
Faster response times when equipment issues arise
A direct path from reactive firefighting to proactive reliability
The maintenance teams that reduce downtime consistently are not the ones working hardest.
They are the ones tracking the right numbers and acting on them before problems escalate.
OpMaint gives maintenance managers a real-time dashboard that tracks every critical smrp metric automatically so your team spends less time pulling reports and more time improving performance.
You Cannot Fix What You Cannot See
Most maintenance managers are working hard.
Scheduling tasks. Managing technicians. Responding to breakdowns. Keeping production running.
But here is the problem.
Working hard without the right data is like driving at night without headlights.
You are moving. But you cannot see what is coming.
SMRP metrics are your headlights.
They show you exactly where your maintenance program is strong and exactly where it is about to fail.
Without them your team is always one step behind. Reacting to problems instead of preventing them.
The Society for Maintenance and Reliability Professionals has defined a set of standardized metrics that give maintenance managers a clear, measurable picture of their program performance.
In this guide you will get:
The exact smrp metrics every maintenance manager must track
What each metric tells you and why it matters
How to use these metrics to directly reduce downtime
How OpMaint tracks every metric automatically in real time
If your team is still pulling maintenance data manually from spreadsheets this guide will show you exactly what that is costing you every single day.
What Are SMRP Metrics and Why Do They Matter?
SMRP metrics are standardized maintenance performance metrics defined by the Society for Maintenance and Reliability Professionals to help organizations measure, benchmark, and improve their maintenance and reliability programs.
They are not vanity numbers. They are operational indicators that tell your team:
How reliable your equipment is
How efficiently your maintenance resources are being used
How effective your preventive maintenance program is
Where your biggest downtime risks are hiding
According to the SMRP official website, these metrics are organized into five pillars:
Pillar 1: Business and Management Metrics that measure the financial and organizational impact of maintenance operations.
Pillar 2: Manufacturing Process Reliability Metrics that measure how consistently production processes perform to their designed capacity.
Pillar 3: Equipment Reliability Metrics that measure how reliably individual assets perform over time.
Pillar 4: Organization and Leadership Metrics that measure the effectiveness of the maintenance organization and its leadership.
Pillar 5: Work Management Metrics that measure how efficiently maintenance work is planned, scheduled, and executed.
Every maintenance reliability metric your team tracks should map to one of these five pillars.
If it does not it is probably not moving the needle on your program performance.
The 8 SMRP Metrics Every Maintenance Manager Must Track
These are the eight smrp kpis that deliver the most direct impact on downtime reduction and maintenance program performance.
1. Mean Time Between Failures (MTBF)
What It Is: Mean time between failures is the average time between one equipment failure and the next.
How to Calculate It: Total operational time divided by the number of failures in that period.
Why It Matters: Mean time between failures tells you how reliable each asset is.
A low MTBF means frequent failures. High maintenance costs. High downtime risk.
A rising MTBF means your preventive maintenance program is working.
What to Do with It: Track MTBF per asset. Identify the assets with the lowest MTBF. Prioritize preventive maintenance investment on those assets first.
OpMaint tracks mean time between failures automatically per asset and flags assets with declining MTBF before they become critical failures.
What It Is: Mean time to repair is the average time it takes your maintenance team to restore a failed asset to operational condition.
How to Calculate It: Total repair time divided by the number of repair events in that period.
Why It Matters: Mean time to repair tells you how efficiently your team responds to failures.
A high MTTR means long production stoppages. Wasted labor hours. Frustrated operations teams.
A falling MTTR means your team is getting faster and more efficient at restoring equipment.
What to Do with It: Track MTTR by asset type and by technician. Identify where repairs consistently take longest. Investigate root causes. Standardize repair procedures through digital work order templates.
OpMaint tracks mean time to repair automatically through work order completion data and gives managers real-time visibility into repair times across every asset and technician.
3. Planned Maintenance Percentage (PMP)
What It Is: Planned Maintenance Percentage measures the proportion of total maintenance work that is planned and scheduled versus reactive and unplanned.
How to Calculate It: Planned maintenance hours divided by total maintenance hours multiplied by 100.
Why It Matters: SMRP benchmarks indicate that high-performing maintenance organizations achieve a PMP of 85 percent or higher.
A PMP below 70 percent means your team is spending most of its time reacting to failures rather than preventing them.
That reactive culture is costing you three to five times more per repair event than planned maintenance would.
What to Do with It: Set a PMP target of 85 percent. Track it monthly. Use your CMMS to increase the proportion of scheduled work orders versus reactive ones.
A structured
preventive maintenance checklist
built into OpMaint automatically shifts your team toward planned maintenance and drives PMP improvement month over month.
4. Overall Equipment Effectiveness (OEE)
What It Is: Overall Equipment Effectiveness measures how effectively your equipment is being used relative to its full potential.
How to Calculate It: Availability multiplied by Performance multiplied by Quality.
Why It Matters: OEE is one of the most comprehensive maintenance reliability metrics available.
It combines equipment availability, production speed, and product quality into a single performance score.
World class OEE is considered 85 percent or higher.
Most facilities operate between 40 and 60 percent OEE without even knowing it.
What to Do with It: Track OEE per production line and per critical asset. Identify which component of OEE is lowest. Availability, performance, or quality. Focus maintenance investment on the component driving the biggest OEE loss.
5. Maintenance Cost as a Percentage of Replacement Asset Value (RAV)
What It Is: This metric measures total maintenance spend as a percentage of the total replacement value of your asset base.
How to Calculate It: Total annual maintenance cost divided by total replacement asset value multiplied by 100.
Why It Matters: SMRP benchmarks indicate that best-in-class facilities spend between 2 and 3 percent of RAV on maintenance annually.
Facilities spending above 5 percent RAV are typically running reactive maintenance programs with high emergency repair costs, excessive parts inventory, and significant unplanned downtime.
What to Do with It: Calculate your current RAV percentage. If above 4 percent investigate where the excess spend is going.
Explore
Asset Management Use Cases
to see how OpMaint tracks total asset replacement value and maintenance spend per asset in real time.
6. Schedule Compliance
What It Is: Schedule Compliance measures the percentage of planned maintenance work orders completed on schedule within a defined period.
How to Calculate It: Work orders completed on schedule divided by total scheduled work orders multiplied by 100.
Why It Matters: Schedule compliance is one of the most direct smrp kpis for measuring maintenance program discipline.
A schedule compliance rate below 80 percent means your maintenance program is consistently falling behind.
Tasks are being deferred. Equipment is going unmaintained. Compliance risk is accumulating.
What to Do with It: Track schedule compliance weekly. Identify the most common reasons for missed schedules.
OpMaint tracks schedule compliance automatically and sends escalation alerts when work orders approach their due dates without completion.
7. Maintenance Backlog
What It Is: Maintenance backlog is the total volume of planned maintenance work that has been identified but not yet completed expressed in labor hours.
How to Calculate It: Sum of all open planned work order hours at any given point in time.
Why It Matters: A healthy maintenance backlog represents two to four weeks of planned work.
A backlog below two weeks suggests insufficient maintenance planning.
A backlog above six weeks suggests your team does not have enough resources to execute the planned maintenance program.
Both extremes are problems.
What to Do with It: Monitor backlog weekly. Use backlog trends to make resource allocation decisions.
8. Corrective to Preventive Maintenance Ratio
What It Is: This metric measures the ratio of corrective reactive maintenance work to preventive planned maintenance work.
How to Calculate It: Corrective maintenance work orders divided by preventive maintenance work orders over a defined period.
Why It Matters: A high corrective to preventive ratio means your program is reactive.
A low ratio means your program is proactive.
SMRP best-in-class benchmarks target a corrective to preventive ratio of 20 to 80.
What to Do with It: Track this ratio monthly. If corrective work consistently dominates review your PM schedules.
Here is the reality most maintenance managers only discover after a major production event.
Without structured maintenance performance metrics your team has no early warning system.
Equipment degrades invisibly. Failure patterns go undetected. Preventive maintenance falls behind without anyone knowing until a breakdown stops production.
The hidden costs of untracked maintenance performance:
Unplanned downtime that costs US manufacturers an average of 50 billion dollars annually
Emergency repair costs that run three to five times higher than planned maintenance
Expedited parts costs from lack of forward planning
Overtime labor from reactive breakdown response
Compliance risk from maintenance records that were never properly captured
Every one of these costs is directly traceable to not tracking the right smrp metrics consistently.
Is your team currently tracking all eight of these metrics? Book Demo with OpMaint today and see how maintenance managers are getting real-time visibility into every metric automatically without pulling a single spreadsheet.
How to Use SMRP Metrics to Directly Reduce Downtime
Tracking metrics is only half the equation.
The other half is using them to make decisions that directly reduce downtime.
Here is the practical framework:
Step 1: Establish Your Baseline Calculate your current MTBF, MTTR, PMP, OEE, and schedule compliance for every critical asset. These numbers are your starting point. You cannot improve what you have not measured.
Step 2: Identify Your Biggest Downtime Drivers Which assets have the lowest MTBF. Which production lines have the highest corrective to preventive ratio. Which technicians have the highest MTTR. These are your priority targets.
Step 3: Set Improvement Targets Based on SMRP benchmarks set specific improvement targets for each metric. MTBF up 20 percent in six months. Schedule compliance above 85 percent. PMP above 80 percent.
Step 4: Adjust Your PM Program Use metric data to refine your preventive maintenance schedules. Assets with low MTBF need more frequent PM. Assets with high MTTR need standardized repair procedures in your work order system.
Step 5: Track Progress Monthly Review all eight metrics monthly. Celebrate improvements. Investigate regressions. Use data to make continuous improvement decisions rather than gut feel.
Step 6: Automate the Tracking Manual metric tracking is unsustainable. Every metric in this guide should be tracked automatically by your CMMS. Not calculated manually from spreadsheets at the end of each month.
The smrp best practices guide gives your team the complete framework for implementing this six step process across your entire maintenance program.
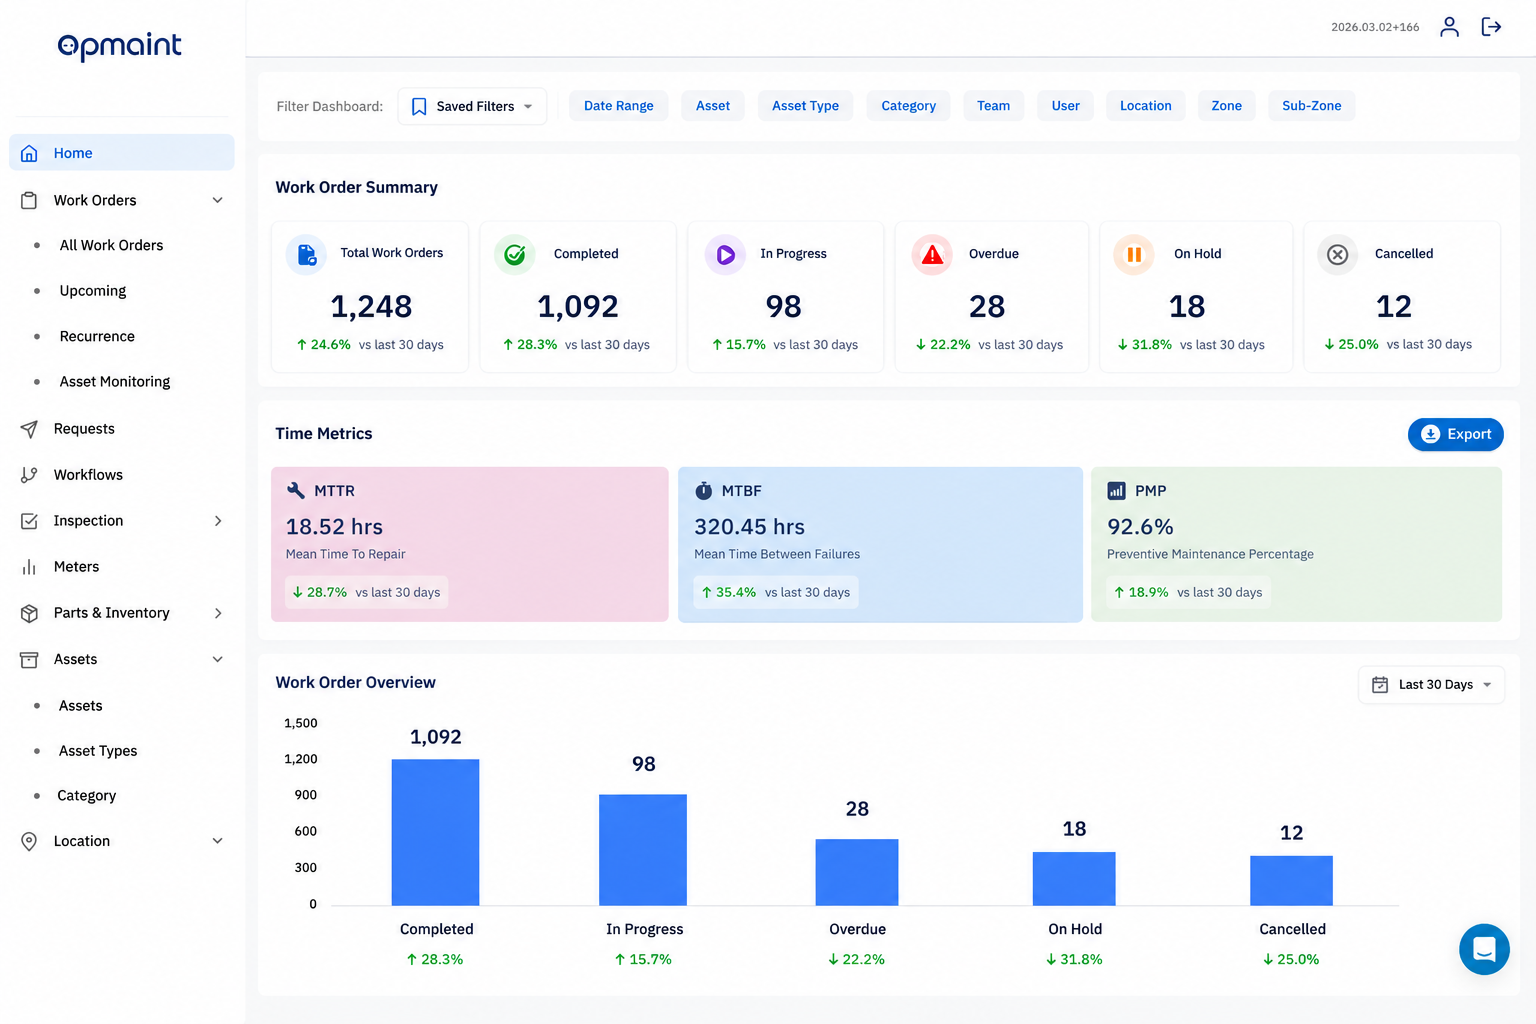
How OpMaint Tracks Every SMRP Metric Automatically
Here is the bottom line.
OpMaint is Manufacturing CMMS Software purpose-built for maintenance teams that need real-time visibility into every smrp metric without adding administrative burden to their operations.
Here is exactly what OpMaint delivers:
Real-Time MTBF and MTTR Tracking OpMaint calculates mean time between failures and mean time to repair automatically from work order data.
No manual calculation. No spreadsheet formulas. Live data updated automatically as your team completes work orders.
Planned Maintenance Percentage Dashboard Every work order in OpMaint is classified as planned or unplanned. PMP is calculated and displayed in real time. Your maintenance manager sees the ratio at a glance. Not at the end of the month after it is too late to act.
Schedule Compliance Tracking OpMaint tracks every scheduled work order against its due date. Schedule compliance is calculated automatically. Overdue tasks are flagged before they become compliance gaps.
Maintenance Backlog Visibility Your maintenance backlog is visible in real time in OpMaint. Total open hours. Priority distribution. Age of outstanding work orders. Everything your manager needs to make resourcing decisions before the backlog becomes a crisis.
Corrective to Preventive Ratio Reporting OpMaint classifies every work order automatically. Your corrective to preventive ratio is always visible. Trending in the right direction. Or flagging a problem before it gets worse.
Asset Level Performance Data Every maintenance reliability metric in OpMaint is available at the individual asset level.
Not just facility wide averages. Per asset. Per production line. Per technician. The granular data your team needs to make targeted improvement decisions.
The cmms smrp guide gives your team the complete picture of how a CMMS operationalizes every SMRP metric in daily maintenance operations.
OpMaint is purpose-built for Restaurant CMMS Software needs and food and beverage manufacturing facilities that need real-time maintenance performance visibility across every critical asset.
The Maintenance Managers Who Reduce Downtime Do One Thing Differently
They do not work harder than everyone else.
They see more than everyone else.
Real-time smrp metrics give maintenance managers a level of operational visibility that reactive teams simply do not have.
They see which assets are trending toward failure before the failure occurs.
They see which technicians are taking longer than average to complete repairs.
They see which PM tasks are consistently falling behind schedule.
They see exactly where their maintenance budget is being consumed and whether it is delivering results.
That visibility is what separates maintenance programs that reduce downtime from maintenance programs that just respond to it.
And that visibility starts with tracking the right maintenance performance metrics every single day.
Understanding what is smrp gives your team the foundational knowledge to implement every metric in this guide effectively.
Your Competitors Are Already Tracking These Numbers. Are You?
Here is the uncomfortable truth.
The best-performing maintenance organizations in US manufacturing are not managing their programs on gut feel and experience alone.
They are tracking smrp kpis consistently. Using data to make decisions. And continuously improving their program performance based on what the numbers tell them.
The facilities that are not tracking these metrics are operating blind.
And in a competitive manufacturing environment operating blind is a cost disadvantage that compounds every single month.
Every hour of unplanned downtime. Every emergency repair. Every missed PM task.
They all show up in the numbers eventually.
The question is whether you see them before or after the damage is done.
OpMaint gives your maintenance team real-time metric visibility to see problems coming. Act before they escalate. And build a maintenance program that consistently outperforms the competition.
Stop managing your maintenance program on gut feel. Start managing it on data.
Book Demo with OpMaint Today
See how maintenance reliability professionals are using OpMaint to implement SMRP standards, improve maintenance performance, and drive measurable operational results.

.webp)

.jpeg)